Data Exploration
There is an icon in the GUI that you can enter into the administrator ui:
![]()
Then you will see the administrator ui.
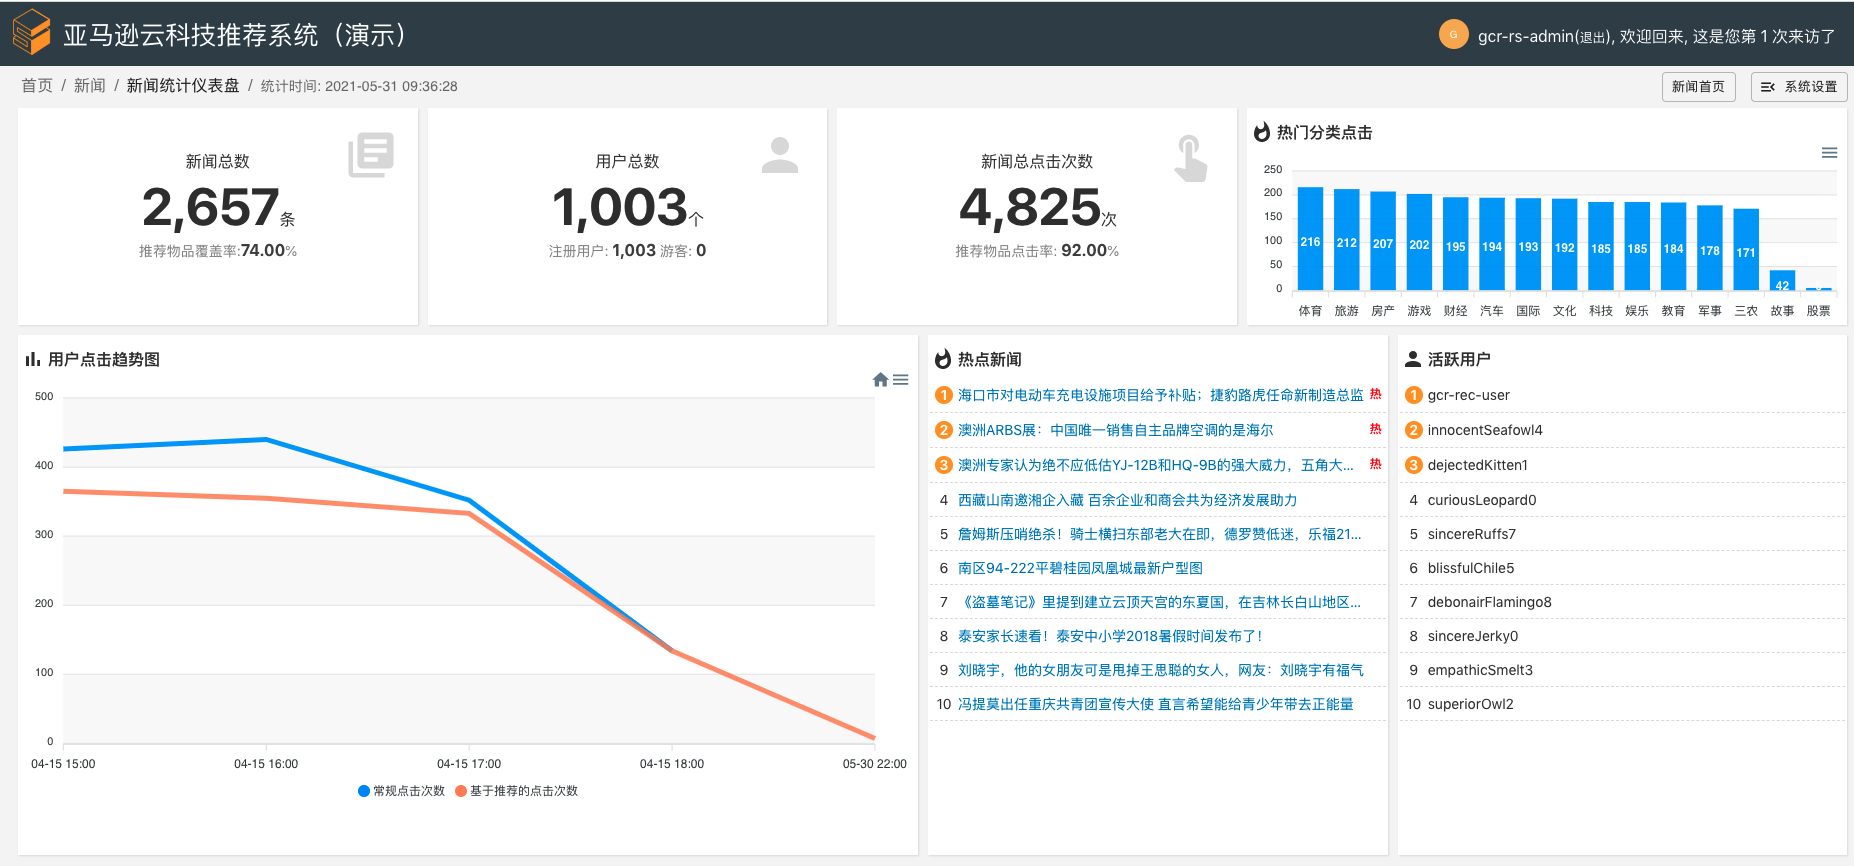
The statistics is carried automatically every 15 minutes. You can see that we have prepared over 2000 news for you. We have prepared 1000 fake users for you. The more you click , you will more likely become the active user. The whole click number, hot topics and hot news are also displayed.
There are many metrics for a recommender system. In this solution, we show the click rate and coverage rate.
The click rate evaluates the performance of recommendation list. The coverage rate shows how many news have been recommended to the user. From the perspective of the system, every news has each value and should recommended to the most suitable user.